Most Commonly Used Maintenance Metrics and How To Track them Efficiently

If you’re responsible for maintaining equipment, you know how important it is to keep them running smoothly and avoid costly downtime. One key to achieving this is by tracking and analyzing common maintenance metrics. By doing so, you can gain insights into the health of your equipment and identify areas for improvement, and optimize your maintenance program.
From the report “The True Cost of Downtime,” large facilities experience an average of 27 hours of machine failures per month, resulting in a cost of $532,000 for each hour of unplanned downtime. This is worth US$864 billion per year across Fortune Global 500 industrial companies. Usually, the cause of such failures is the absence of knowledge about the right metrics, let alone the process to track them.
With the right metrics at their disposal, companies can establish robust performance benchmarks and prioritize improvement, strategy, and long-term growth. This entails identifying improvement areas, aligning KPIs with overall business strategy, and a strong monitoring process.
Overall, by tracking maintenance metrics, you can remarkably improve the outcome from your equipment. As a result, here, in this blog post, we’ll explore some of the most common maintenance metrics and tips on how to track them effectively.
Exploring Essential Metrics for Effective Maintenance Management
A holistic equipment maintenance and management strategy is supported by relevant maintenance performance metrics and a strong monitoring system. Here, we first start by exploring the common metrics that are used to improve and optimize maintenance operations, ensuring data-driven decision-making and enhanced efficiency.
Mean time to repair (MTTR)
MTTR is the measurement of the average time taken to fix a piece of equipment or machinery after it has malfunctioned. It’s like a stopwatch that ticks from the moment a machine fails to the point it is back in working condition.
MTTR= total repair time / total number of repairs
It is an essential measure of maintenance efficiency, and a low MTTR indicates that the maintenance team can quickly identify and resolve equipment failures. This means less downtime and more time for production. In contrast, a high MTTR indicates that maintenance processes may not be effective, leading to increased downtime and reduced productivity.
By tracking MTTR, organizations can pinpoint the root cause of equipment failure and take necessary steps to prevent similar failures in the future.
Emergency work orders (EWOs)
EWO is an unplanned or emergency maintenance task that requires immediate attention to prevent further damage or safety hazards. EWOs are a critical measure of maintenance team responsiveness and agility.
It is calculated by,
EWOs = Total emergency work orders / Total number of work orders
When an EWO is raised, it’s a race against the clock to get the equipment up and running as quickly as possible. Tracking EWOs helps organizations identify recurring issues and evaluate the effectiveness of their maintenance processes. A high number of EWOs is an indication of poor equipment reliability or a lack of preventive maintenance.
Planned maintenance percentage (PMP)
Planned maintenance percentage is a measure of the percentage of maintenance tasks that are planned and scheduled in advance. It’s like a forecast for maintenance work that needs to be carried out in the future, ensuring that everything is in order before it becomes a problem.
PMP = Planned maintenance hours / Total maintenance hours × 100
Tracking PMP enables maintenance teams to identify areas for improvement and optimize their maintenance processes further. For example, if PMP is low, maintenance teams may need to adopt more preventive maintenance measures or improve scheduling practices. Leveraging preventive maintenance software can help streamline these efforts by automating scheduling, tracking maintenance tasks, and ensuring timely interventions. PMP values over 90% are described as world-class maintenance, whereas values over 70% are acceptable.
Mean time between failures (MTBF)
Mean time between failures (MTBF) is a measure of how often equipment fails within a specific time frame or how frequently a particular type of failure is anticipated to occur.
MTBF=total number of operational hours / total number of failures
MTBF is a useful metric for evaluating the effectiveness of maintenance strategies and identifying areas for improvement. For example, if MTBF is low, it may indicate a need for more frequent preventive maintenance or a requirement for equipment upgrades or replacements. Calculating the mean time between failures is one method you may use to start controlling unplanned downtime at your business.
Overall equipment effectiveness (OEE)
Overall equipment effectiveness (OEE) is a powerful metric that measures the performance, availability, and quality of equipment. This is like a report card for equipment, providing a comprehensive overview of how well the equipment is functioning and how it can be optimized for maximum efficiency.
OEE is expressed as a percentage and calculated as:
OEE = Availability x Performance x Quality
We offers a data-driven view of the effectiveness and efficiency of your maintenance procedures. To reduce product defects, an OEE value of 100% is what you should aim for. By adopting proactive maintenance measures, maintenance professionals can increase OEE to more than 90% as maintenance statistics from Deloitte have found.
Maintenance Backlogs
Maintenance backlogs refer to the accumulation of maintenance tasks that have not been completed, either because of a lack of resources or because of other priorities. A high maintenance backlog suggests that maintenance teams are struggling to keep up with demand, leading to equipment downtime and increased maintenance costs.
Maintenance Backlogs = Number of pending work orders / Total number of work order
A decent maintenance backlog value is achieved by prioritizing maintenance tasks, improving scheduling practices, or increasing resources.
Preventive maintenance compliance (PMC)
The percentage of tasks completed on time as per the schedule is known as PM compliance. It’s an additional metric for assessing the consistency and resource-saving effectiveness of a Preventative Maintenance (PM) program. It is expressed by,
PMC = (Number of PM tasks completed on schedule / Total number of PM tasks) x 100%
As a general guideline, PM tasks should be completed within 10% of the planned maintenance interval. Monthly PMs must be finished three days before the deadline.
A high PMC indicates that maintenance teams are following the preventive maintenance schedule effectively, while a low PMC indicates needed improvements in maintaining compliance.
Equipment downtime
Equipment downtime refers to the time that equipment is not functioning due to maintenance or unplanned issues. It can have a significant impact on business operations, causing delays, reduced productivity, and increased costs. Equipment downtime can be calculated by,
Equipment downtime = Total downtime / Total available production time x 100%
By analyzing equipment downtime, maintenance teams can identify patterns and trends that may point to larger issues with equipment, such as recurring breakdowns or failures. According to the International Society of Automation (ISA), at each downtime incident, factories lose between 5 and 20 percent of their productive potential.

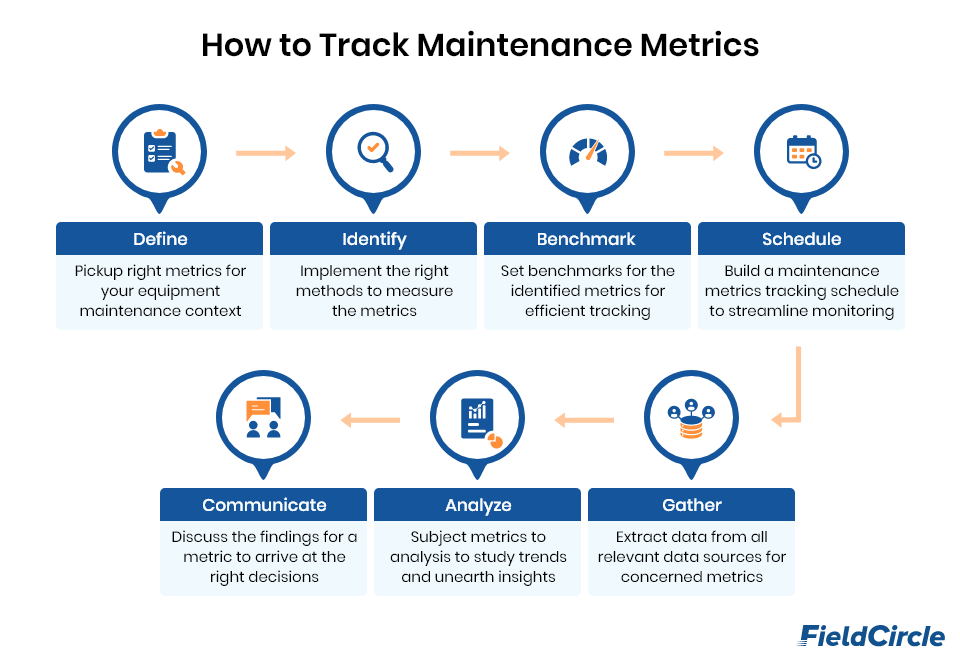
Tips on How to Track Maintenance Metrics Effectively
Tracking these metrics can be challenging, especially if you’re not sure where to start. Here are some tips on how to track maintenance metrics effectively.
Kick start by defining
Before you start tracking the metrics, it’s essential to define what you’re measuring and why. You should clearly define each metric and ensure that it aligns with your maintenance objectives. This will help you ensure that you’re tracking the right metrics and using them to improve maintenance performance effectively. By outlining the metrics above, we have simplified this task for you.
Identify and proceed
Once you have identified your key metrics, the next step is to identify the methods to measure them. You can use various tools such as data collection software, maintenance management software, spreadsheets, or manual logs. Ensure that your methods are consistent to avoid errors in measuring metrics.
Measuring maintenance metrics will follow a mix of generic and contextual approaches, because data extraction process may majorly remain the same for most metrics. Depending upon the complexities of data collected and metric calculation complexities, data cleaning and exploratory data analysis will follow accordingly.
Benchmark to succeed
Benchmarks are critical in tracking effective maintenance metrics because they provide a reference point for comparison. Without benchmarks, it is challenging to determine whether you are improving or not. Some common benchmarks include:
- Industry Benchmarks: Benchmarks based on industry standards and best practices.
- Internal Benchmarks: Based on your organization’s past performance or the performance of similar equipment.
- External Benchmarks: Based on the performance of your competitors or other organizations in similar industries.
Move up with a schedule
To track these metrics effectively, you need a schedule for maintenance data collection and recording. This will depend on the frequency of maintenance activities, the type of metrics you are tracking, and the data collection method.
Gather and extract
Collect data regularly and record it accurately. This may require training your team to use specific data collection methods like sensor technology, condition-based monitoring, or software tools. For example, condition-based monitoring is particularly useful for identifying potential failures before they occur. Be consistent in your data collection to ensure that your metrics are accurate and reliable.
Unearth and explore
Analyze the data you have collected to identify trends, patterns, and areas for improvement. This may involve root-cause analysis to determine the underlying causes of failures or downtime. By identifying the root cause, you can take corrective actions that will prevent future failures. And compare the data to benchmarks to determine performance. Use this information to develop and implement a maintenance strategy to improve your metrics.
Communicate to help interpret
Communicate the output of your maintenance KPIs to your team, stakeholders, and management. This will help everyone understand the current state of your maintenance program and any areas that need improvement. Use this communication to get buy-in for any changes that you need to make to improve your metrics.
Getting Practical Insights
A mid-sized maintenance service provider was facing challenges in keeping track of maintenance operations and managing the team’s workload. It approached us, and after analysis of the context, we identified the key metrics that were essential to improve the maintenance process.
In order to overcome the toughest challenge – tracking the identified maintenance metrics, we implemented our CMMS and configured it to their bespoke needs.
The results were remarkable. Apart from automating task tracking, our solution resulted in downtime reduction and increase in planned maintenance percentage. The software also streamlined their yearly audit and freed its team from remaining stuck to minute details, allowing them to focus on the larger picture and resulting in cost savings in the long term.
Streamline Maintenance Metric Tracking with a Robust Maintenance Software Suite
Organizations use maintenance KPI metrics to get crucial data about equipment performance and reliability. Although they are commonly used, each metric contains unique information. These common maintenance metrics are ultimately responsible for maximizing the potential of the equipment.
When tracking metrics, it’s essential to understand what these metrics tell you and how they can help you improve your operations. With the help of reliable maintenance management software, organizations can streamline performance metrics tracking in one centralized location, allowing for better communication and collaboration across teams. This helps to improve maintenance operations, reduce costs, and increase overall efficiency.
Drive Growth with
Modern CMMS
Software
- Increase Profitability
- Reduce Costs